How to use TheStockCatalyst to find the best stocks that release earnings reports
TheStockCatalyst was born out of a need to find information quickly about earnings reports to trade them at market open. For these trading setups you need to find the companies on the NYSE and NASDAQ stock exchange that are releasing earnings today or released them after hours the day before. The NASDAQ site (and many other sites) have a calendar available which lists the companies that have announced they will release earnings on a certain day. During earnings season this list can grow to hundereds of companies on a particular day, so it's a lot of work to track down how the earnings are that a company has released and how the stock price is reacting during premarket. For each company that you are interested in you need to find their earnings report, the news on how the market is reacting and the premarket price action. Those are a lot of Google searches.
So here is where TheStockCatalyst comes in to assist. TheStockCatalyst gets the earnings release calendar for you and adds a headline related to the earnings release and the stock price information in one handy overview.
Now there are two ways to find high probability earning plays on TheStockCatalyst.
Top Premarket Earnings Movers
First there is the Top Premarket Earnings Movers page. This page shows 2 lists of the top 20 stocks, whose prices move the most premarket up or down percentage wise. It only lists stocks that have an earnings report coming out today or that had an earnings report yesterday after hours. When their earnings are released the relevant headline will show up, so you can have an impression if they met earnings expectations or not. The prices shown are the current premarket prices with a slight delay. The prices will stop updating after market open.
The overview also shows the volume in premarket trading in the stocks. The lists can be sorted by change or by volume. You can sort by volume or by the percentuale change by clicking on the small arrows next to the title.
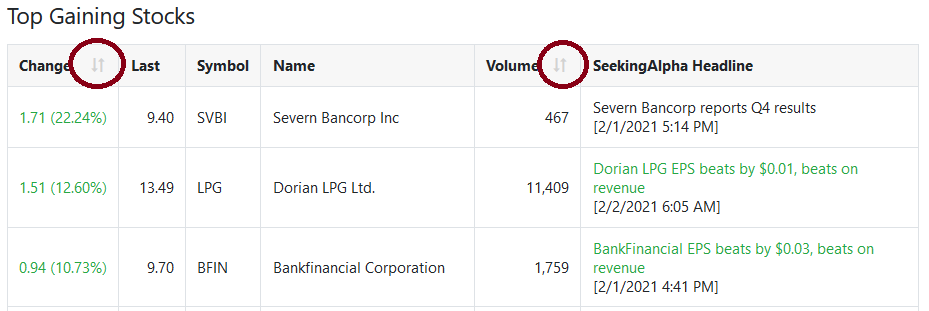
In this manner you can have a quick overview of the stocks that have an earnings report and that have a large movement in price and that have a large trading volume. Meaning that these stocks will probably have a lot of volatility on market open.
Premarket Earnings Screener
If you would like more control on the selection process of the earnings stocks, there is the Premarket Earnings Screener. This overview lists all the stocks from the NASDAQ Earnings Calendar, that are either releasing an earnings report today premarket or have released an earnings report yesterday after hours.
This overview has more columns than the top movers overview, namely:
- Release date: the day that the company is releasing an earnings report according to the NASDAQ calendar.
- Time: the timeslot that the earnings will be released. This can be 'PM' for premarket, 'AH' for after hours or '??' if its unkown when the earnings report will be released.
- Est. time: the whispered time when the earnings will be released. This is not a confirmed time, but an expected time that the earnings report might come.
- Symbol: the stock symbol for the company.
- Name: the name of the company.
- Market Cap (M): the current market capitalization in millions of US dollars.
- Est. EPS: the estimated earnings per share. This is an average of expected earnings for this company by Wall street analists.
- Last years EPS: the earnings per share that this company reported the same quarter last year.
- SeekingAlpha Headline: the headline that SeekingAlpha released for this companies earnings. Mostly the headline says a company beats or misses the estimated EPS and revenue and by how much. This headline has a green color if is beats all estimations, a red color if it misses all estimations or it's black otherwise. There is also the timestamp when the headline was released to give an indication when the earnings were released for sure.
- Price: the current price the share is trading at during normal market hours (with some delay). This number is updated during normal market hours. During extended hours, it shows the closing price of the last market session.
- Change: the price difference compared to the previous close.
- Ext. Hours Price: the current price the share is trading at during the extended session, so premarket or after hours (with some delay). This number is updated during the extended hours session. During normal market hours, it shows the closing price of the last extended session.
- Ext. Hours Change: the price difference compared to the previous close.
- 52 Week Range: the 52 week low and the 52 week high of the stock price. If the current price is around the low or the high, they will be printed in bold.
- Volume: the current trading volume for the stock during normal market hours (with some delay). This number is updated during normal market hours. During extended hours, it shows the final amount of volume of the last market session.
- Avg. Volume: the average daily trading volume for the last year.
- Ext. Hours Volume: the current trading volume for the stock during the extended session (with some delay). This number is updated during the extended hours session. During normal market hours, it shows the final amount of volume of the last extended session.
- Top Gainer/Loser: this shows a checkmark if the stock is a top gainer or loser according to TheStockMarketWatch
Like on the Top Premarket Earnings Movers page, the different columns can be sorted by clicking on the little arrows in the title of the column.
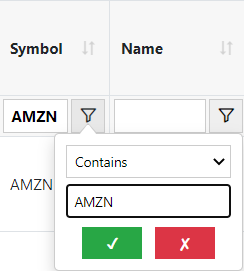
The overview can be sorted by one or multiple columns at a time. To sort on multiple columns, hold the SHIFT or CTRL key and press the little sorting arrows in the order you want to sort by. Furthermore the columns that have the little funnel icon can also be filtered. Click on the funnel icon and the filter options will be shown.
For the 'Symbol' and 'Name' columns you can enter a text and select an option how the text should match and then press the green checkmark button. With the red x button you remove the filter again.
For the 'Time' and 'SeekingAlpha Headline' columns, you can only select the given options in the list. You can select multiple options by holding down the CTRL button and clicking the entries you want to match.
So, for example, if you want to only show the companies that are releasing an earnings report premarket and have a headline, you first select 'Equals' and 'PM' in the 'Time' column filter.
And then in the 'SeekingAlpha Headline' column filter, you select 'Not equals' and 'Empty'.
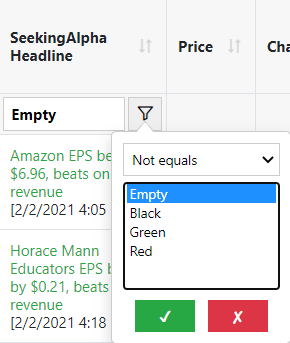
Now only stocks that are releasing earnings premarket and that have a headline
(in other words, the earnings report has been released and SeekingAlpha put out a news item). As with the sorting, you can remove the filter again by clicking the red x button.
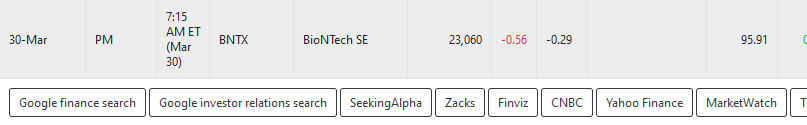
When you click on the row for a stock when its highlighted in grey, a row with link buttons will open. The links lead directly to different news sources for this stock. So it will open the
relevant page for this stock on that site. For example, in the image above, if you click the Finviz button, the Finviz page for BioNTech will be opened in a new tab.
In this manner you can use your own criteria to select and scan companies that have earnings coming out that you would like to trade.